


Debugger commands are displayed in a menu bar with pull-down submenus, and on the debugger's toolbar. Commands can be selected either from the menus or from the keyboard. A menu item that is followed by three dots (such as Accept...) requires a value. You will be prompted for the value unless you highlight it within the source code before you choose the option. Some, but not all, commands may be selected from the toolbar. You can determine toolbar functions by placing the mouse over a button and holding it there for a brief period.

The Debugger Menu Bar and Toolbar (Windows).
If you don't have a mouse, use the F10 to access the debugger menu bar. Then use the arrow keys to move within the menu system. Press <return> or <spacebar> to make your selection. Typing the key letter is another way to make a selection, if key letters are available on your system. From the menu bar, press F10 to toggle back to the debugger command line.
On systems such as Windows that include a System Menu in the Debugger window, you can activate the System Menu by pressing the function key F9. F9 will also activate the System Menu of any window displayed over the Debugger window.
The debugger displays the first ten characters of the name of the current program, followed by the current address (in hexadecimal). This name is derived from the PROGRAM-ID in the Identification Division of the source code.
The commands described on the following pages may be used in all debugging modes, unless marked with one or two asterisks.
![]() One asterisk (*) indicates that the option is available in source-level
debugging only ("-Zd" compiler option).
One asterisk (*) indicates that the option is available in source-level
debugging only ("-Zd" compiler option).
![]() Two asterisks (**) indicate that the option is available in either
source-level or symbolic-level debugging ("-Zd" or "-Zs" compiler option), but not in low-level debugging.
Two asterisks (**) indicate that the option is available in either
source-level or symbolic-level debugging ("-Zd" or "-Zs" compiler option), but not in low-level debugging.
Keep in mind that you must compile with "-Zd" or "-Zs" in order to reference variables by name. If the program wasn't compiled with one of these options, refer to each variable by its absolute address as shown in a program listing.
The tables below list all debugger commands available through the keyboard, with their menu equivalents given in parentheses. The same listing is accessible through the H (Help) debugger command.
Source-Level Commands
| Command (menu)
| Description
|
| <F1> or <Page Up>
| Scrolls source up one page.
|
| <F2> or <Page Down>
| Scrolls source down one page.
|
| <F3> (Run/Go to Cursor Line)
| Sets a temporary breakpoint at the current cursor line and continues execution of your program.
|
| <F4> (Breakpoints/Toggle at Cursor Line)
| Sets or removes a breakpoint at the source line containing the cursor.
|
| <F5> or <Up Arrow>
| Moves the source cursor up one line.
|
| <F6> or <Down Arrow>
| Moves the source cursor down one line.
|
| <F7>
| Causes the cursor line to be searched for program variables. If one is found, its name and current contents are displayed.
|
| <Tab>
| Search the current line for selectable text. If selectable text is found, select it.
|
| @! (Run/Skip to Cursor Line)
| Moves the current program location to the line containing the cursor.
|
| F (Source/Repeat Find)
| Repeats the last Find command, starting at the current cursor line.
|
| FB pat (Source/Find Backwards)
| Locates pat in the program's source code. The debugger searches backwards from the current cursor line.
|
| FF pat (Source/Find Forward)
| Locates pat in the program's source code. The debugger searches forward from the current cursor line.
|
| FT pat (Source/Find from Top)
| Locates pat in the program's source code. The debugger starts at the top of the current program source.
|
| VP (View/Perform Stack)
| Lists all of the nested paragraphs leading up to the current statement, starting from the beginning of the program.
|
| W procedure (Source/Paragraph)
| Positions the cursor at the procedure you name. The procedure must be located in the current program.
|
| W@ (Source/Current Line)
| Positions the cursor at the current line in your program.
|
| WB (Source/Last Line)
| Positions the cursor at the last line (bottom) in your program.
|
| WT (Source/Line 1)
| Positions the cursor at the first line (top) of your program.
|
Other Commands
| Command (menu)
| Description
|
| ! (File/Shell)
| Invokes the operating system's command processor, allowing you to enter commands.
|
| <script-file (File/Run Script)
| Runs a script file. Causes all input (debugger and program) to be read from the script. Control returns to the keyboard when the script is finished.
|
| > (File/Stop Recorder)
| Ends your recording. If you don't end your recording, nothing is saved in the file.
|
| >script-file (File/Record Script)
| Turns on a recorder that saves all of your keyboard input and menu selections to a file of your choice.
|
| A variable (Data/Accept)
| Lets you modify the contents of a variable.
|
| B (View/Breakpoints) (Breakpoints/View)
| Displays a dialog box with all existing breakpoints. You can add/modify breakpoints from this dialog box.
|
| B address, [skip #] (Breakpoints/Set)
| Sets a breakpoint with a skip count. The breakpoint will not be activated until it has been hit skip# times.
|
| B address, [SKIP #], [WHEN cond] (Breakpoints/Set)
| Sets a breakpoint with a skip count and/or condition. The breakpoint will not be activated unless cond is true # times.
|
| C address (Breakpoints/Clear)
| Removes a breakpoint. You can enter either the breakpoint's paragraph name or hexadecimal address.
|
| CA (Breakpoints/Clear All)
| Removes all breakpoints.
|
| CM number (Data/Monitor/Clear)
| Clears variable monitor number.
|
| CMA (Data/Monitor/Clear All)
| Clears all variable monitors.
|
| D variable [, X] (Data/Display)
| Shows the contents of a variable. The value is shown in the debugger command window. If X is appended to the display command, the variable is displayed in hexadecimal.
|
| E (File/Exit Debugger)
| Turns off the debugger while continuing the execution of your program.
|
| G (Run/Continue)
| Resumes execution of your program from its current location.
|
| G address
| Sets a temporary breakpoint at address, and continues execution.
|
| GE (Run/Go until Program Exits)
| Runs your program until the current program exits to its calling program.
|
| GP (Run/Go until Paragraph Returns)
| Runs your program until the current paragraph returns to the point from which it was performed.
|
| H
| Displays help (these debugger command tables).
|
| L
| Displays the name of source paragraph or section which is being executed.
|
| M (View/Monitors) (Data/Monitor/List)
| Shows all monitored variables and their values. This also displays a sequence number for each monitor, which is used to clear the monitor.
|
| M variable (Data/Monitor/Set)
| Causes the program to stop whenever the named variable changes its value. The variable is shown in the watch window.
|
| P [#]
| Steps over the next statement. With a count, the program will step count times.
|
| Q! (File/Quit)
| Halts your application and exits the debugger.
|
| R script
| Run script as a debugging script. Causes the debugger to read commands from the script (but user input is gathered normally).
|
| RA [#] (Run/Run all Threads)
| Toggles or sets the "Run All Threads" setting. If # is 0, only the current thread will run. If # is non-0, all threads will run.
|
| S [#] (Step Into)
| Executes one statement of your program and then returns control to the debugger. You may follow the command with the number of steps to take.
|
| SA (Run/Auto Step)
| Causes your program to execute "step" commands repeatedly until it reaches the end of the program., or until you stop the auto-step by pressing <SPACE> while the debugger is active.
|
| ST [#] (Run/thread)
| Switches to the thread identified by the given number (or the next thread, if no number is given). Numbers correspond to the threads as given under the "Run" menu item.
|
| T flush
| Causes the error file to be flushed to disk after each write, if you are writing to an error file.
|
| TF [#] (File/Trace Files)
| Turns on file tracing. The # indicates the level of tracing, from 1 to 9, where 1 is the lowest and 9 is the highest.
|
| TP (File/Trace Paragraphs)
| Toggles paragraph tracing, which is a listing of all paragraphs and sections entered at runtime.
|
| U (View/Memory Usage)
| Displays the amount of dynamically allocated memory currently used by the runtime system.
|
| V (View/Screen)
| Displays your application's current screen. Press any key or click the left mouse button to return to the debugger.
|
| WA (Data/Monitor/Set)
| Places a variable in the watch window. The difference between a watched variable and a monitored variable is that watched variables don't cause program execution to halt when they change.
|
| WS number (Source/Window Size)
| Specifies the number of lines to show in the command window.
|
| WW number (Source/Watch Size)
| Specifies the number of lines to display in the watch window.
|
| <F8>
| Edit Command causes the last command entered to be recalled for editing.
|
| <ctrl-n>
| Shows the next line in the watch window.
|
| <ctrl-p>
| Shows the previous line in the watch window.
|
Multithreading Issues
When a program is running under the debugger, by default the "run all threads" ("RA") mode is turned on. In this mode, you step through only one thread at a time, but the background threads run normally. If a background thread reaches a breakpoint, it returns control to the debugger and becomes the current thread. The last debugging mode you select is saved into your ".ADB" file, so the default mode applies only when you do not have a ".ADB" file.
At your option, you can execute one thread at a time in the debugger. This allows you to trace a thread without interference from other threads. When a new thread starts, the debugger informs you, but continues tracing the parent thread. You can switch to another thread with the "ST" (Switch Threads) command.
You can find a list of the current threads under the "Run" menu item. This list shows you the current program and address where each thread is executing. You can select the appropriate menu item to switch to that thread as an alternative to the "ST" command.
The debugger can manage only ten threads simultaneously.
Getting help
Under Windows, you can access an on-line Help facility from the Help option at the far right of the debugger menu bar. This provides a brief description of each debugger command.
In other environments, access help by typing the letter "H" at the debugger prompt and then pressing <return>.
The File Menu
The File menu contains commands relating to the overall operation of the debugger.
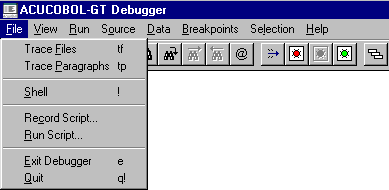
The File Menu (Windows).
Trace Files toggles file tracing on or off.
A file trace is a listing of all file operations performed at runtime.
The trace is sent to the same place that error output is sent. So, to prevent the trace from overwriting your application's screen, be sure to use the runtime's "-e" command-line option (followed by a file name) to direct error output to a file.
See the runtime configuration variable MAX-ERROR-LINES in Appendix H to limit the size of the error file.
Some file systems can print extra information if a higher level of tracing is enabled. This extra information is mostly useful to the Technical Support department at Acucorp, and they may ask you to execute a "tf n" for some integer "n".
File trace example:
runcbl -de trace.fil program1
Make sure that the error file you designate (trace.fil in the example above) does not exist in the current directory. If it does, it will be emptied.
The keyboard form of this command is "TF [#]".
**Trace Paragraphs toggles paragraph tracing on or off.
Paragraph tracing is a listing of all paragraphs and sections entered at runtime.
A paragraph trace is sent to the same place that error output is sent. So, to prevent the trace from overwriting your application's screen, be sure to use the runtime's "-e" command-line option (followed by a file name) to direct error output to a file.
The keyboard form of this command is "TP".
Shell pulls up the operating system's command processor, allowing you to enter commands.
The keyboard form of this command is "!".
Record Script turns on a recorder that saves all of your keyboard input and menu selections to a file of your choice. Debugger commands and input to the program being debugged are both saved.
Play back the recording with the Run Script command.
See also the description of the W$KEYBUF routine in Appendix I.
When the recorder is running, the Record Script menu option is replaced by a Stop Recorder option. Use this to end your recording. If you don't end your recording, nothing is saved in the file.
While the recorder is active, you won't be able to use the mouse for anything except selecting menu items. Mouse actions are very position-dependent and are often difficult to replay.
The recorder can save up to 4096 characters of information. Normal keystrokes use one character. Special keys such as function keys and menu selections typically use up to four characters.
The keyboard form of this command is "> script-file". The runtime doesn't process the filename. To turn off the recorder, use ">" by itself.
Run Script runs a debugger script file. Control returns to the keyboard when the script is finished.
The keyboard form of this command is " < script-file".
Exit Debugger turns off the debugger but continues execution of your program.
The keyboard form of this command is "E".
Quit halts your application and exits the debugger.
The keyboard form of this command is "Q!".
The View Menu
The View menu contains commands related to viewing and monitoring your program.
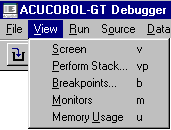
View Screen displays your application's current screen. Press any key or click the left mouse button to return to the debugger.
The keyboard form of this command is "V".
*View Perform Stack lists all of the nested paragraphs leading up to the current statement, starting from the beginning of the program (or the beginning of the thread, if a new thread was started). Double-clicking on one of the names in the list takes you to that paragraph and highlights the current statement in that paragraph. The trace also accounts for embedded procedures and declaratives.
In order to use this command, you must have compiled for source-level debugging (-Zd), and your program must allow for recursive performs (-Zrl). Recursive performs are the default.
The keyboard form of this command is "VP".
View Breakpoints displays a dialog box that lists all of your breakpoints and allows you to modify them, add new ones, view the next line of code containing a breakpoint, disable a breakpoint, and clear a breakpoint. It shows the location and skip count for each breakpoint. For breakpoints that are located in the current program, the paragraph they are contained in is also listed.
The keyboard form of this command is "B".
View Monitors shows all monitored variables and their values. It also displays a sequence number for each monitor. You need the sequence number to clear an individual monitor. See Data/Monitor/Clear, below.
The keyboard form of this command is "M".
Memory Usage displays the amount of dynamically allocated memory currently used by the runtime system. There are five types:
Program memory is the memory directly used by your programs' Data and Procedure Divisions. This includes all programs in memory--not just the current program.
File memory is memory used by your open files, including the indexed file cache.
Window memory is memory used by your pop-up windows. This includes the debugger's own pop-up window.
Overhead memory is memory used directly by the runtime system that is not controlled by your program.
Dynamic memory is memory allocated by the program via the M$ALLOC library routine.
The keyboard form of this command is "U".
The Run Menu
The Run menu contains commands related to executing your program.
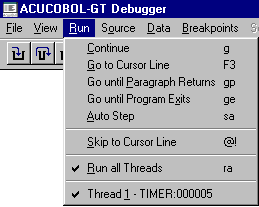
The Run Menu (Windows).
Continue resumes execution of your program from its current location. The program returns to the debugger when it reaches the next breakpoint.
The keyboard form of this command is "G".
*Go to Cursor Line sets a temporary breakpoint at the current cursor line and continues execution of your program. Press the F3 key to use this command from the keyboard. The F3 key works on lines that do not contain verbs. The closest previous line with a verb is the location used to set the breakpoint.
Go until Paragraph Returns runs your program until the current paragraph returns to the point from which it was performed.
The keyboard form of this command is "GP".
Go until Program Exits runs your program until the current program exits to its calling program. If used from inside your main program, this command runs the program until it finishes.
The keyboard form of this command is "GE".
Auto Step causes your program to execute "step" commands repeatedly until it reaches the end of the program. When you select this mode, the debugger immediately begins stepping through your program. You can change the speed at which it is stepping by typing a digit from "1" (slowest; approximately three seconds per step) to "9" (fastest; several steps per second). Press the <spacebar> to leave Auto Step mode and return to the debugger prompt.
The keyboard form of this command is "SA".
Step and P-Step are not shown on the menu but are available from the keyboard. Windows users can find equivalent commands, and others, on the toolbar provided with the debugger. The toolbar is explained at the end of section 3.1.3.
Step executes one statement of your program and then returns control to the debugger.
The keyboard command is "S". You may follow the keyboard command with a number of steps to take.
P-Step executes a "perform step." This is the same as a normal Step command, except that it includes the entire range of a PERFORM statement as a single statement. The effect is to step to the end of the performed paragraph.
The keyboard command is "P." You may follow the keyboard command with the number of "perform steps" to take.
*Skip to Cursor Line moves the current program location to the line containing the cursor. Further execution of your program will proceed from this line. The cursor line must contain a verb; otherwise the current program location does not change.
Use this command with care, because the skipped lines are not executed. You may skip important sections of code and experience unexpected results.
The keyboard form of this command is "@!".
Run all Threads toggles or sets the "Run All Threads" setting. Once it is set, all threads run simultaneously under the debugger. Though all threads run simultaneously, only the debugger's current thread is traced when you are stepping through a program. However, breakpoints in other threads are active and can transfer control to the debugger, as can a trapped error (such as a table boundary violation). When a thread other than the current thread returns control to the debugger, that thread becomes the current thread.
The keyboard form of this command is "RA [#]".
Thread shows the threads contained in the program, and places a check mark next to the current thread.
The Source Menu
The Source menu contains commands related to viewing your source code. These commands are available with source-level debugging.
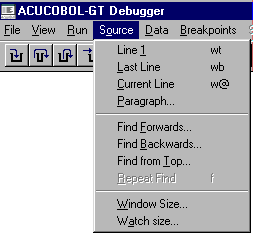
The Source Menu (Windows).
*Line 1 positions the cursor at the first line of your program.
The keyboard form of this command is "WT".
*Last Line positions the cursor at the last line in your program.
The keyboard form of this command is "WB".
*Current Line positions the cursor at the current line in your program.
The keyboard form of this command is "W@".
*Paragraph prompts you for a procedure name and positions the cursor there. The procedure must be located in the current program.
The keyboard form of this command is "W procedure".
*Find Forwards prompts you for text to locate in the program's source code. The debugger searches forward, starting at the cursor line. Case is not considered, so you don't have to match the capitalization of the text you want to locate.
The default text for the search is shown in a dialog box. This is the current selection (the currently highlighted variable or procedure name). If nothing is selected, the default is the last search string. If you don't want the default, simply type over it.
Before you choose Find Forwards, you can highlight a variable or procedure name by clicking on it. If you don't have a mouse, use the arrow keys to move to the desired line and then press <tab> to highlight the desired name.
The keyboard form of this command is "FF text".
*Find Backwards prompts you for text to locate in the program's source code. The debugger searches backwards, starting at the cursor line. Case is not considered, so you don't have to match the capitalization of the text you want to locate.
The default text for the search is shown in a dialog box. This is the current selection (the currently highlighted variable or procedure name). If nothing is selected, the default is the last search string. If you don't want the default, simply type over it.
Before you choose Find Backwards, you can highlight a variable or procedure name by clicking on it. If you don't have a mouse, use the arrow keys to move to the desired line and then press <tab> to highlight the desired name.
The keyboard form of this command is "FB text".
*Find from Top prompts you for text to locate in the program's source code. The debugger searches for the text, starting at the top of the current program source. Case is not considered, so you don't have to match the capitalization of the text you want to locate. This is usually a convenient way to find the definition of a COBOL data item.
The keyboard form of this command is "FT text".
*Repeat Find repeats the last Find command, starting at the cursor line.
The keyboard form of this command is "F".
Window Size sets the number of lines to show in the command window. This may be any integer from 2 to 14, inclusive.
The keyboard form of this command is "WS number".
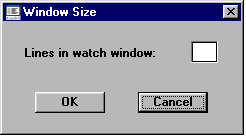
*Watch Size pops up a dialog box which asks for the number of lines to display in the Watch Window. You may enter any number up to 16, which is the maximum number of monitor/watch lines available. A number greater than 16 will return an error message "Invalid size" and a prompt to re-enter the number. The watch window size dialog box (actually titled "Window Size") looks like this:
The keyboard form of this command is "WW number".
The Data Menu
The Data menu contains commands relating to your program's variables.
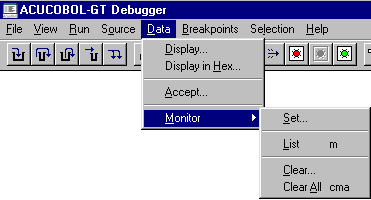
The Data Menu (Windows).
You may use name qualification with the Display, Accept, and Monitor commands. For example, you may type "FIELD-1 IN GROUP-1" to refer to FIELD-1 of GROUP-1. Name qualification is not supported for on-screen commands (such as F7) and for situations in which you double-click on the data name.
Display shows the contents of a variable. (With source-level debugging, you can either click on the variable name in the code before you select Display, or wait to be prompted.) Numeric variables are converted to show their value. Other variables are shown as text. The value is shown in the debugger command window.
Table elements cannot be highlighted with a mouse click. Instead, use this keyboard command:
"D variable (index)"
Follow the variable's name with the desired index in parentheses. The index must be a numeric literal.
Keep in mind that you must compile with "-Zd" or "-Zs" in order to reference variables by name. If the program wasn't compiled with one of these options, you must refer to each variable by its absolute address from a program listing.
The keyboard form of this command is "D variable".
Display in Hex shows the contents of a variable in hexadecimal. (With source-level debugging, either click on the variable name in the code before you select Display in Hex, or wait to be prompted for the name.)
This option allows you to determine the data stored in each byte of the variable. The value is shown in the command window below the source code.
Table elements cannot be highlighted with a mouse click. To view a table element, follow the variable's name with the desired index in parentheses, as shown here:
D variable (index), X
The index must be a numeric literal.
Keep in mind that you must compile with "-Zd" or "-Zs" in order to reference variables by name. If the program wasn't compiled with one of these options, you must refer to each variable by its absolute address from a program listing.
The keyboard form of this command is "D variable, X".
Accept allows you to modify the contents of a variable. (With source-level debugging, either click on the variable name in the code before you select Accept, or wait to be prompted for the name.) For numeric variables, the value entered is converted to the internal storage format of the variable.
The current value of the variable is shown as the default. To leave the current value in place, press <enter>.
Table elements can't be highlighted with a mouse click. To modify a table element, follow the variable's name with the desired index in parentheses, as shown here:
A variable (index)
The index must be a numeric literal.
Keep in mind that you must compile with "-Zd" or "-Zs" in order to reference variables by name. If the program wasn't compiled with one of these options, you must refer to each variable by its absolute address from a program listing.
The keyboard form of this command is "A variable".
Monitor -The Monitor submenu contains commands that relate to monitored variables.
Set displays a dialog box which prompts you for the name of a variable to be included in the Watch Window. (For source-level debugging, either click on the variable name in the code before you select Monitor, or wait to be prompted for the name.) The Monitor dialog box looks like this:
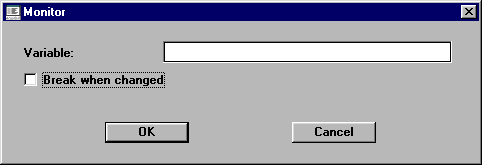
The Monitor dialog box includes a check box labeled "Break when changed". When this box is checked, the selected variable becomes monitored, and if it is unchecked, the variable is "only" watched. The default value of this check box is On (checked).
Any time a monitored variable changes, the program stops executing and control returns to the debugger, where the new value of the variable is displayed in the command area of the debugger window.
You can tell which variables in the Watch Window are monitored by the phrase "(break)" following the variable name (i.e., those variables for which the "Break when changed" check box was clicked on). The watched variables do not have this phrase displayed after their names
When any variables are set for monitor/watch, a new window is created as a sub-window of the main debugger canvas, located at the top of the screen. This window, called the "Watch Window", shows all the monitored/watched variables and their values, one name/value per line (values which exceed the size of the window are truncated). By default, the Watch Window contains as many lines as there are variables being monitored, up to a maximum of three (3). If you set more than 3 variables, you can scroll through the Watch Window to view them all, or you may set a larger Watch Window size with the Window Size option from the Source menu. The maximum number of variables you can set is 16. The Watch Window looks like this:

To monitor a table element, follow the variable's name with the desired index in parentheses, as shown here (table elements can't be highlighted with a mouse click):
M variable (index)
The index must be a numeric literal.
Keep in mind that you must compile with "-Zd" or "-Zs" in order to reference variables by name. If the program wasn't compiled with one of these options, you must refer to each variable by its absolute address from a program listing.
The keyboard form of this command is "M variable".
List shows all monitored variables and their values. Also displays a sequence number for each monitor. You need the sequence number to clear an individual monitor. See Clear, below.
The keyboard form of this command is "M".
Clear clears a monitor from one variable. You will be prompted to identify the variable by number. Use the List option to display all monitors and their numbers.
The keyboard form of this command is "CM number".
Clear Allclears all monitors.
The keyboard form of this command is "CMA".
The Breakpoints Menu
The Breakpoints menu contains commands for managing a program's breakpoints.
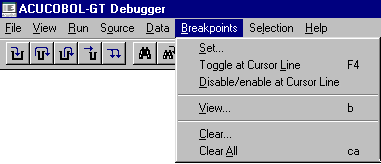
The Breakpoints Menu.
A breakpoint is a location in your program's code that you designate. It causes control to return to the debugger. Control is returned before the code at the breakpoint location is executed.
Breakpoints are displayed in the source. An enabled breakpoint shows as "B" in column 1, a disabled breakpoint as "b" (lowercase) instead. The "@" sign (showing the program's current location) displays over the "B" if the current line is also a breakpoint.
Breakpoints are saved between sessions. The breakpoints are stored in a file that is named "{username}.adb", where "{username}" is your login name, as known by the runtime. This file is placed in the directory named by the "ACUCOBOL" environment variable, or the current directory, if that variable is not set. In addition to your breakpoints, the run-all-threads state is recorded, as well as the last size of the debugger's window. Keep in mind that although breakpoints are saved between sessions, they are not saved between compiles.
Set allows you to set a breakpoint at a paragraph. Selecting Set displays the Set Breakpoint dialog box.
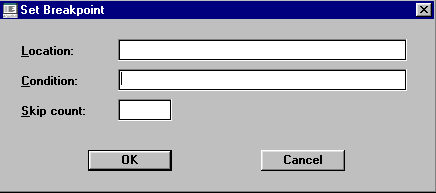
Set Breakpoint Dialog Box
You are prompted for a breakpoint Location, Condition, and Skip count.
The Location field prompts you for a hexadecimal address and a program name, although the current cursor location is supplied as the default breakpoint address location. Hexadecimal addresses are specified with a "." (period) as the first character, as described in section 3.1.6.2. A breakpoint is set at that address in the program. If you omit the program name, the current program is used. To obtain the hexadecimal address of a line of code, use the compiler's program listing.
Suppose you want to set a breakpoint in a called program in the run unit, but you don't know the exact address. First, make sure you've compiled the called program with source-level debugging. Then, from the current program, set the breakpoint at address "0", called-program-name. The debugger breaks as soon as the called program is entered. You see the called program's source code on the screen, and the called program's name on the command line. The called program is now the current program, and you can use Set or Toggle at Cursor to set the desired breakpoint.
Breakpoints can have a condition, known as the "When Condition," specified for them. The condition is entered into the Condition field. The breakpoint is activated only when the condition is true. For breakpoints with a skip count (see below), the skip count is decreased only when the condition is true. Conditions are simple comparisons between two numeric or alphanumeric data items or literals, including figurative constants (exception: the ALL literal is not supported). The allowed comparisons are "=", "<", ">", "<=" and ">=". You may place the word "NOT" before any of these operators. The comparisons are done according to the rules for COBOL. Any data items referenced must exist in the program containing the breakpoint. If the condition is not meaningful or is illegal (including table boundary violations), then the breakpoint is immediately activated when it is reached and an error message follows.
In the Skip count field, enter the number of times to skip the breakpoint. The breakpoint doesn't activate until the skip count reaches zero. The keyboard form of this
command is
"B address, counter"
This command can also be set from the command line with:
"B address [,program] [,SKIP count] [,WHEN condition]"
A second command that is also supported but does not allow conditions to be set is:
"B address [,program] [,count]"
*Toggle at Cursor Linesets or removes a breakpoint at the source line containing the cursor.
To use this command from the keyboard, press F4. The F4 key works on lines that do not contain verbs. The closest previous line with a verb is the location used.
Disable/enable at Cursor Line allows you to keep a breakpoint location while turning off the breakpoint. You can disable/enable breakpoints from the menu or from the Breakpoint dialog box.
View is the same as the "list breakpoints" command ("B"). It displays a dialog box that lists all of your breakpoints and allows you to modify them, add new ones, view the next line of code containing a breakpoint, disable a breakpoint, and clear a breakpoint. It shows the location and skip count for each breakpoint. For breakpoints that are located in the current program, the paragraph they are contained in is also listed.
Clear removes a breakpoint. At the prompt, you can enter either the breakpoint's paragraph name or hexadecimal address. Hexadecimal addresses are specified with a "." (period) as the first character, as described in section 3.1.6.2. Exact addresses are given in the View command described above.
To use this command from the keyboard, type "C address".
Clear All removes all breakpoints.
To use this command from the keyboard, type "CA".
The Selection Menu
The Selection menu lists actions you can take on the current selection.
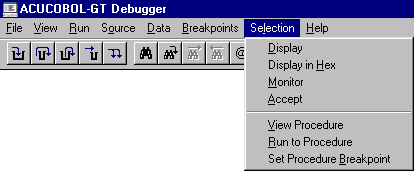
The Selection Menu (Windows).
A selection is a variable or procedure name that you have highlighted in the source window. If you don't have a mouse, use the arrow keys to move to the desired line and then press <tab> to highlight the desired name.
*Display shows the contents of the selected variable. Numeric variables are converted from their internal formats to show their values. Other variables are shown as text.
You can also perform this by double-clicking the left mouse button on the desired variable.
*Display in Hex shows the contents of the selected variable in hexadecimal notation. Allows you to view the internal storage of every byte in the variable.
*Monitor sets a monitor on the selected variable. Changes to a monitored variable cause control to return to the debugger. This feature gives you the option to have the COBOL program stop executing, and the debugger to activate, when the value of a monitored variable changes. When this happens, the debugger window becomes the active window, and the variable and its value are displayed in the command area of the debugger.
When any variables are monitored, a new window is created as a sub-window of the main debugger canvas, located at the top of the screen. This window, called the "Watch Window", shows all the monitored variables and their values, one name/value per line (values which exceed the size of the window are truncated). By default, the Watch Window contains as many lines as there are variables being monitored, up to a maximum of three (3). If you select more than 3 variables for monitoring, you can scroll through the Watch Window to view them all, or you may set a larger Watch Window size with the Window Size option from the Source menu. This is what a Watch Window looks like:

*Accept "accepts" a new value for the selected variable. For numeric variables, the value you enter is converted to the variable's internal storage format.
*View Procedure scrolls the source window to the start of the selected procedure.
You can also perform this by double-clicking the left mouse button on the desired procedure name.
*Run to Procedure sets a temporary breakpoint at the selected procedure and continues program execution. The program runs until it reaches the selected procedure (or another breakpoint).
*Set Procedure Breakpoint sets a permanent breakpoint at the selected procedure.
Up and Down are available only for non-Windows environments. Windows users can perform the same tasks by using the scroll bar to the right of the debugger screen.
*Up scrolls up towards the top of the source code by one-half screen.
*Down scrolls down towards the bottom of the source code by one-half screen.
Help for Windows users is discussed in the next section. In other environments, you can get help by typing the letter "H" and pressing <return> at the debugger prompt.
The following debugger commands are available but are not shown on the debugger menus:
*F1, Page Up scrolls source up one page.
*F2, Page Down scrolls source down one page.
*F5 (or the Up arrow) moves the source cursor up one line.
*F6 (or the Down arrow) moves the source cursor down one line.
*F7 causes the cursor line to be searched for program variables. If one is found, its name and current contents are displayed. Press F7 multiple times to cycle through all of the variables on the line.
F7 (display variable on current line) and the Tab key (highlight variable on current line), as well as the mouse, also pay attention to qualified and indexed data items in the source. As long as a variable and all of its qualifiers and indexes are on one line, the entire expression is evaluated by these keys. If a variable and all of its qualifiers and indexes span multiple source lines, the entire expression is ignored, but component items are still found.
*F8 Edit Command causes the last command entered to be recalled for editing. Useful for correcting typographical errors.
*H, Help Key displays a screen of summary help information.
The Help Menu
The Help menu is available only for Windows users. It provides access to a Windows-style Help facility for the debugger. Invoking help opens the "/etc/cblhelp" file and displays its contents on the screen. If you have not put this file in the "/etc" directory, the Help command returns the message "Can't open /etc/cblhelp".

The Help Menu (Windows).
Contents shows you the Debugger Help table of contents.
Search allows you to search for specific words, as you would in a book index.
Help on Help opens the native Windows help file that explains how help files can be used.
About the Runtime gives you information regarding the runtime, such as the runtime version number, serial number, copyright information, and license number.
The Toolbar
Windows users can use the debugger's toolbar for a variety of operations. To display a description of any button on the toolbar, place the mouse pointer over the button and hold it there for a few seconds. Depending on the state of the debugger, some of the icons may be dim (unavailable).
![]()
The Debugger Toolbar (Windows).
Step Into executes one statement of the program and then returns control to the debugger. It is the equivalent of the keyboard command "S."
Step Over allows you to "step over" a performed paragraph. It is the same as Step Into except that it includes the entire range of a PERFORM statement as a single statement. It is the equivalent of the P-step command.
Step Out lets you run to a performed paragraph's exit.
Run to Cursor (F3) sets a temporary breakpoint at the current cursor line and continues execution of your program.
Auto Step causes your program to execute "step" commands repeatedly until it reaches the end of the program.
Find brings up dialog box for entering a word or phrase you want to locate.
Find from Top locates the next occurrence of the last found word or phrase.
Find Next locates the next occurrence of the last found word or phrase.
Find Previous locates a previous occurrence of the last found word or phrase.
Find Current Line sets the source view to the current program location.
Go runs the program to the next breakpoint.
Toggle Breakpoint (F4) sets or removes a breakpoint at the source line containing the cursor.
Disable Breakpoint allows you to keep a breakpoint location while turning off the breakpoint.
Remove All Breakpoints clears all breakpoints from the program.
Perform Stack displays the current Perform stack, listing all of the nested paragraphs leading up to the current statement.