

Debugger commands are displayed in a menu bar with pull-down submenus and on the debugger's toolbar. Commands may be selected either from a pull-down menu or from the keyboard. You are prompted for the value unless you highlight it within the source code before you choose the option. Some, but not all, commands may be selected from the toolbar. You can determine toolbar functions by placing the mouse over a button and holding it there for a brief period.
If you don't have a mouse, use F10 to access the debugger menu bar. Then use the arrow keys to move within the menu system. Press <return> or <spacebar> to make your selection. From the main menu bar, press F10 to return to the debugger command line.
The debugger command line displays the first ten characters of the name of the current program, followed by the current address (in hexadecimal). This name is derived from the PROGRAM-ID paragraph.
Debugger commands are listed on the next several pages. Those which are enclosed in parentheses are source debugging commands, and are available only if the program was compiled with the "-Gd" option. These are not described in this manual. Commands with a double asterisk (**) are symbolic debugging commands, and are available if the program was compiled with the "-Zs" option. All others are low-level debugging commands, and are available no matter how the program was compiled.
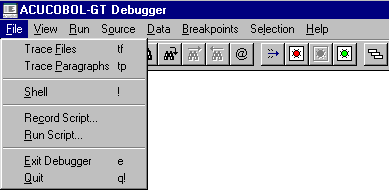
The File menu contains commands relating to the overall operation of the debugger.

| Trace Files
| Toggles file tracing on/off. Keyboard command is "TF[#]".
|
| **Trace
Paragraphs | Toggles paragraph tracing
on/off. Keyboard command is "TP". |
| Shell
| Pulls up system command processor. Keyboard command is "!".
|
| Record Script
| Begins recording keyboard input. Keyboard command is "> script-file".
|
| Run Script
| Runs recorded script file. Keyboard command is "< script-file".
|
| Exit Debugger
| Turns off debugger; program continues. Keyboard command is "E".
|
| Quit
| Stops debugger and program. Keyboard command is "Q!". |
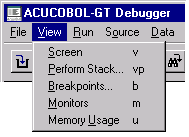
| View Screen
| Displays application's current screen. Press any key or click the left mouse
button to return to the debugger. Keyboard command is "V".
|
| (View Perform Stack)
| Available with source debugging only.
|
| View
Breakpoints | Lists all of your breakpoints and
allows you to modify, add, view next, disable, and clear a breakpoint. Shows location and skip count for each. Keyboard command is "B". |
| View Monitors
| Shows all monitored variables and their values. Displays a sequence number
for each monitor. You need the sequence number to clear an individual monitor.
See Data/Monitor/Clear, below. Keyboard command is "M".
|
| View Memory
Usage | Displays the amount of dynamically allocated memory currently used by the runtime system. Keyboard command is "U". |
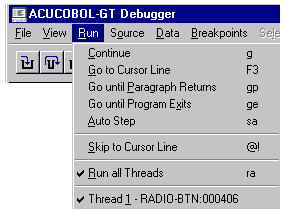
| Continue
| Resumes execution of program from current location. Program returns to the
debugger at next breakpoint. Keyboard command is "G".
|
| (Go to Cursor Line)
| Available with source debugging only.
|
| Go until
Paragraph Returns | Runs program until current paragraph returns to point from which it was
performed. Keyboard command is "GP".
|
| Go until Program Exits
| Runs your program until the current program exits to its calling program. If
used from inside your main program, this command runs the program until it
finishes. Keyboard command is "GE".
|
| Auto Step
| Causes program to execute "step" commands repeatedly until end of program. To
change speed, type a digit from "1" (slowest) to "9". Press <spacebar> to
leave Auto Step and return to debugger prompt. Keyboard command is "SA".
|
| Step and P-Step
| These are not shown on the menu but are available from the keyboard. Windows
users can find equivalent commands, and others, on the toolbar provided with
the debugger.
|
| Step
| Executes one statement of your program and then returns control to the
debugger. Keyboard command is "S". You may follow the keyboard command with a number
of steps to take.
|
| (P-Step)
| Available with source debugging only.
|
| (Skip to Cursor Line)
| Available with source debugging only.
|
| Run all Threads
| Toggles the "Run All Threads" setting. (Default is ON.) When it is on, all
threads run simultaneously under the debugger. Only the debugger's current
thread is traced when you are stepping through a program. However, breakpoints in
other threads are active and can transfer control to the debugger, as can a
trapped error (such as a table boundary violation). When a thread other than the
current thread returns control to the debugger, that thread becomes the current
thread. Keyboard command is "RA [#]".
|
| Thread
| Shows the threads contained in the program and places a check mark next to the current thread. |
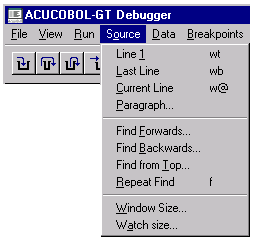
All commands in the Source menu are available only with source debugging, except the following:
| Window Size
| Sets the number of lines to show in the command window; must be an integer from 2 to 14, inclusive. Keyboard command is "WS number". |
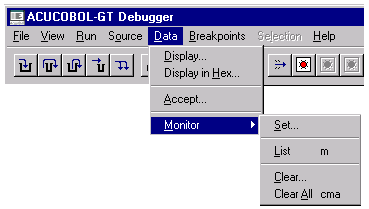
| Display
| Displays the contents of a variable. Keyboard command is "D variable".
|
| Display in Hex
| Displays the contents of a variable in hexadecimal. Keyboard command is "D variable, X".
|
| Accept
| Allows you to modify the contents of a variable. Keyboard command is "A variable".
|
| Monitor
| Activates the submenu. |
| Set
| Tells the debugger to monitor a variable in the Watch Window; you may
preselect or wait for prompt. Keyboard command is "M variable".
|
| List
| Lists all monitored variables and their values and sequence numbers. Keyboard
command is "L".
|
| Clear
| Stops monitoring a variable, identified by sequence number. Keyboard command
is "CM number".
|
| Clear All
| Stops monitoring all variables. Keyboard command is "CMA". |
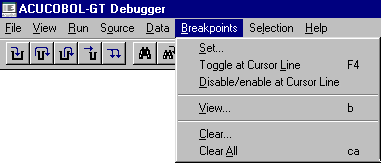
| **Set
| Sets a breakpoint at a paragraph in the Procedure Division of the current
program; prompts you for location, condition, and skip count of breakpoint.
Keyboard command is "B address, counter".
|
| (Toggle at Cursor Line)
| Available only with source debugging.
|
| (Disable/enable at Cursor Line)
| Available only with source debugging.
|
| View
| Lists the location and counter for each breakpoint, and allows you to modify
or add breakpoints.
|
| Clear
| Removes a breakpoint from an address. Keyboard command is "C address".
|
| Clear All
| Removes all breakpoints. Keyboard command is "CA". |
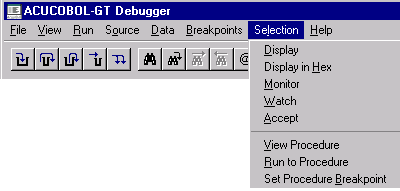
Up and Down are available only for non-Windows environments and only with source debugging.
![]()
| Help
| This option provides access to the Help facility for the debugger. Type H and press <enter> for help. |

| Contents
| Shows the Debugger Help table of contents.
|
| Search
| Allows you to search for specific words, as in a book index.
|
| Help on Help
| Opens the native Windows help file that explains how help files can be used.
|
| About the Runtime
| Shows information regarding the runtime. |