

This chapter describes how to use the ACUCOBOL-GT runtime debugger and other utility programs supplied with ACUCOBOL-GT.
runcbl contains a built-in source-level debugger. This debugger runs in a window that overlays the screen so that the active program is not disturbed.
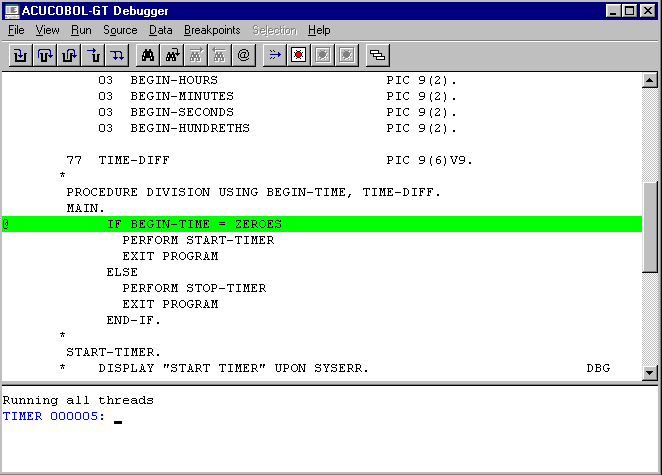
All environments contain a menu bar and command window. When you are running the debugger in a Microsoft Windows environment, a scroll bar is placed to the right of the source. You can use it to scroll through the source. Users of other environments can use the "Up" and "Down" menu items in place of scroll bars. The debugger in Windows also contains a toolbar.

The Debugger Window (Windows).
The debugger can be run at any time, but in order to reference the program's symbols by name, or view the source code, you must have compiled the program with some special options.
The runtime debugger supports three modes of operation: source debugging, symbolic debugging, and low-level debugging.
Source Debugging
Source debugging is the typical mode of debugging and is the most useful, because it allows you to view the source code while you are debugging. In order to use source debugging, you must compile the program with the "-Gd" option. Because this compiler option causes all of the source code to be bundled with the object code, you'll notice that the size of your object code grows considerably.
Symbolic Debugging
Symbolic debugging does not allow you to view the program source, but does allow you to reference paragraphs and variables by their COBOL identifiers. The advantage to using symbolic debugging rather than source debugging is that the compiled object module is much smaller. This may be useful if disk space is very tight. Some application developers compile their programs with symbolic debugging for delivery to clients in order to facilitate the resolution of client questions over the phone. You must compile the program with the "-Gy" option to use symbolic debugging.
Low-Level Debugging
Low-level debugging is available at any time even if the program was not compiled with any debugging options, but you must use absolute addresses to access variables, so you'll need a listing of your program. Low-level debugging is convenient when you're debugging a data-dependent problem on a client's machine, if the client does not have a debug-version of your program. The "Trace Files" command described in section 3.1.4 operates in this mode. "Trace Files" is particularly useful for tracking data-specific problems in complex applications.
More: